


Maps that work in any website.
The map arrives as ready-made pictures, so it loads in every browser and works with the map tools most websites already use, such as Leaflet and OpenLayers. Seven styles, from city streets to hiking trails.
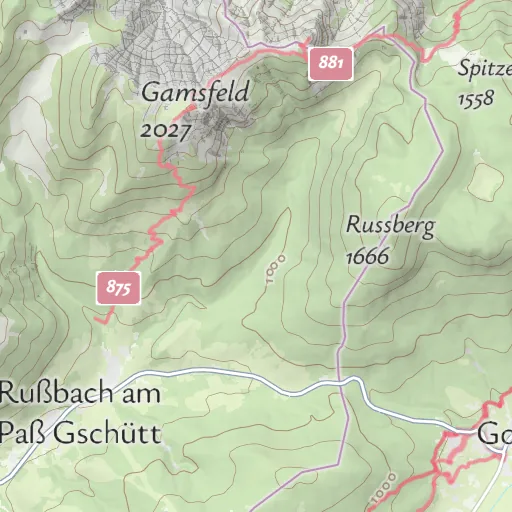
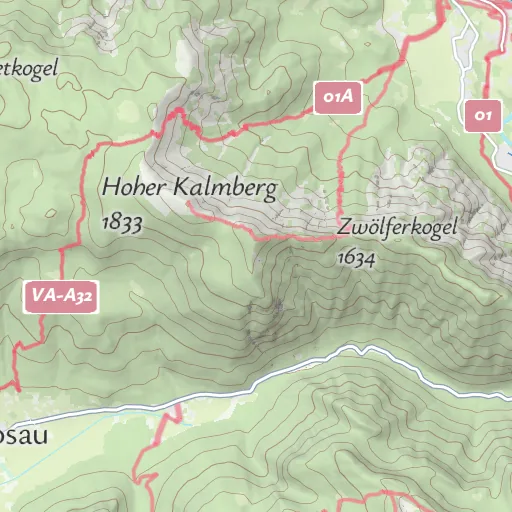
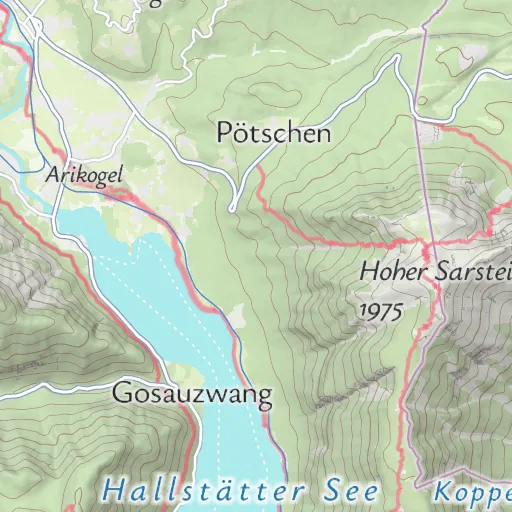
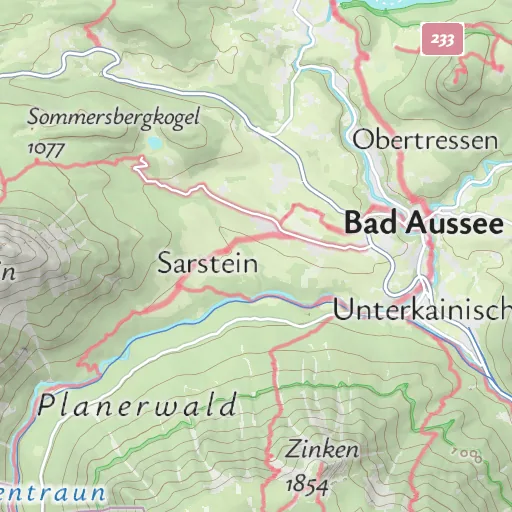
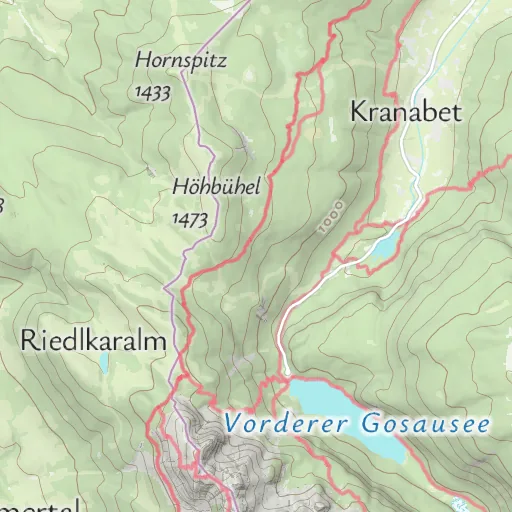
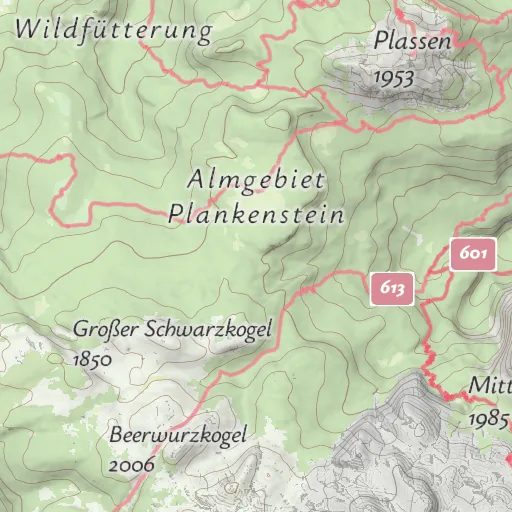
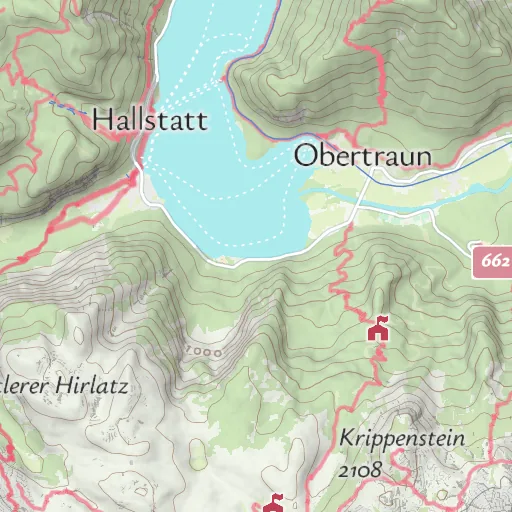
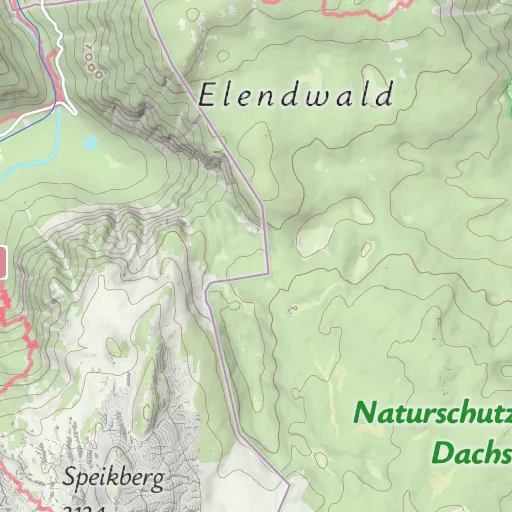
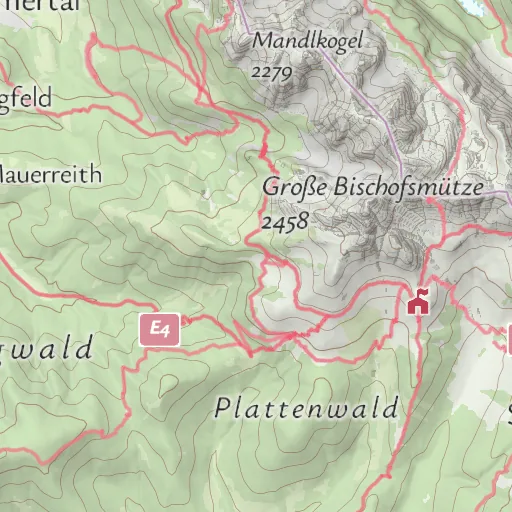
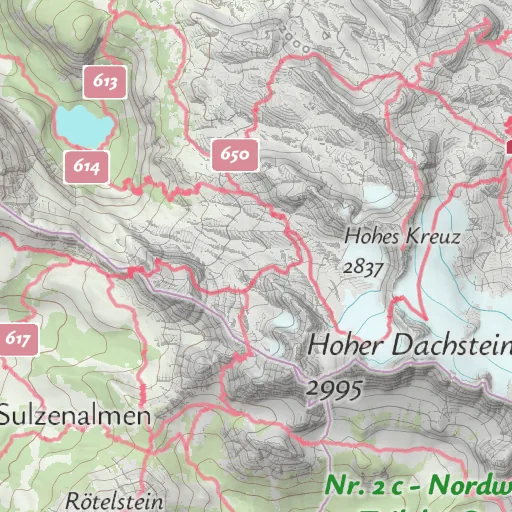
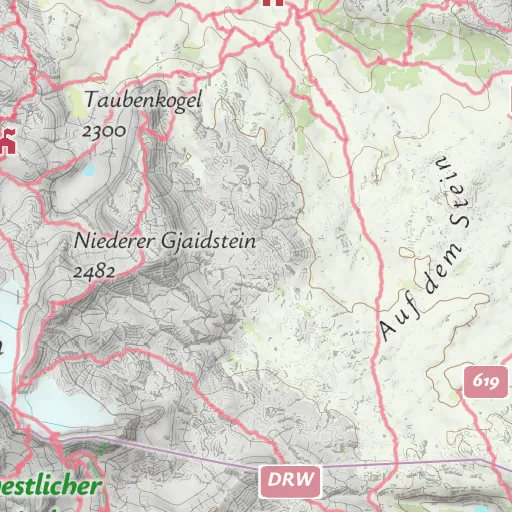
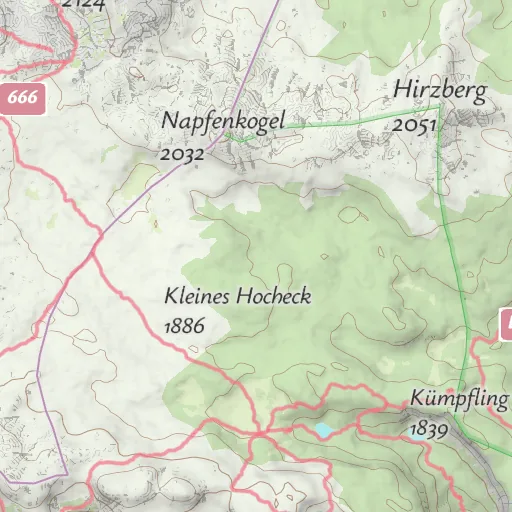
Two ways to show the same maps.
Both show the same seven styles. They differ in how the map reaches the screen and which map tools can show it.
Raster Tiles API
Ready-made map pictures
- The map arrives as finished pictures, drawn on our servers.
- Works with the map tools most websites already use, such as Leaflet and OpenLayers.
- Loads on any device and browser, also without 3D graphics support (WebGL).
- A flat map, from the whole world down to street level (zoom 1 to 20).
- You add the map credit (attribution) to your map yourself.
Vector Tiles API
Map data drawn in the browser
- The map arrives as data, and the browser draws it.
- Needs a modern map library such as MapLibre GL JS or Mapbox GL JS.
- Smooth zooming, because the browser redraws the map at every step.
- Turns without loading new pictures, and can show mountains in 3D.
- The map credit (attribution) is shown automatically.
Seven map styles for different uses.
Every style is available as raster tiles, so you can switch between them or offer several to your visitors.
Summer
Outdoor map with mountains shaded in relief. The default style.
Winter
A winter look for snow and ski regions.
Hiking
For hiking, with waymarked trails and their signs.
Cycling
For cycling, with cycle routes and cycle paths.
Street
Detailed city map for towns and cities.
Light
Light and quiet, so your own content stands out.
Dark
Dark style with strong contrast.
One web address for all tiles.
Paste one tile address into your map library. The library then works out which pictures it needs and loads them.
L.tileLayer(
  "https://rtc-cdn.maptoolkit.net/rtc/"
    + "maptoolkit-maptoolkit.summer/{z}/{x}/{y}{ratio}.png"
    + "?api_key=YOUR_API_KEY",
  { ratio: L.Browser.retina ? "@2x" : "",
    attribution: "© Maptoolkit © OpenStreetMap" }
).addTo(map);
The ratio option loads sharper tiles on high-resolution screens.
Works with your map library
Leaflet, OpenLayers and any other tile map library. The docs show Leaflet in plain JavaScript, React, Vue and Angular.
No 3D graphics needed
The pictures are drawn on our servers, so the browser needs no WebGL.
Standard picture tiles
PNG tiles of 256 x 256 px in the common XYZ scheme.
Sharp on every screen
With @2x in the address, tiles come at 512 x 512 px for high-resolution screens.
From world to street
Zoom levels 1 to 20.
Seven styles or your own
Seven standard styles. Custom styles in your brand colors come with Enterprise.
One API key
Your key goes into the tile address (api_key).
Map credit
Raster tiles carry no credit of their own, so you set it in your map (attribution).
What you can build with raster maps.
Three common uses, shown with real OpenStreetMap data:
Destination and outdoor websites
Huts, trails and sights on an outdoor map, in the map tool the website already uses.
Property and location search
A quiet map under the places you list, with the area around each one.
Web apps and dashboards
Your own data, such as stations or vehicles, on a dark or light background map.
Questions about raster tiles.
Short answers on vector maps in Leaflet, changing the map, static images and TileJSON.
Can I use Maptoolkit vector tiles in Leaflet instead?
Yes. The maplibre-gl-leaflet plugin draws the Maptoolkit vector styles inside an ordinary Leaflet map, and your markers, popups and controls keep working. You get labels in your readers’ language, sharp rendering at every zoom level and a style you can change in the browser. It needs WebGL and a second library, so if you need none of that, raster tiles are the lighter option.
Can I change the colors of the raster map or hide parts of it?
Not in the browser. Raster tiles are finished images with roads and labels already drawn in, so you cannot restyle them on the fly, hide layers or put your own data below the labels. You can switch between the seven standard styles, and with Enterprise you get raster tiles in a custom style made for your brand. To change the map yourself in the browser, use the Vector Tiles API.
When should I use the Static Maps API instead of raster tiles?
Use the Static Maps API when you need one finished map picture, for example in an email, a PDF or as a thumbnail. Raster tiles are for interactive maps: a library such as Leaflet or OpenLayers loads the tiles people need as they pan and zoom. If nobody moves the map, a single static image is the simpler choice.
Is there a TileJSON for the raster styles?
Yes. Every style has a TileJSON document at rtc-cdn.maptoolkit.net/rtc/ followed by the style name and .json, for example maptoolkit-maptoolkit.summer.json. Add @2x before .json for the high-resolution version. It lists the tile address, zoom range, bounds and tile size, so tools that read TileJSON can set up the layer for you. Like the tiles, it needs your API key.
Find the right map for your project.
In a demo we show the seven styles on your region and talk through what a map in your own colors would involve.