


Interactive maps for your website and app.
Sharp, fast maps your visitors can zoom and turn, in seven designs from city streets to hiking trails. The map data comes from OpenStreetMap, is updated every week and is hosted in the EU.
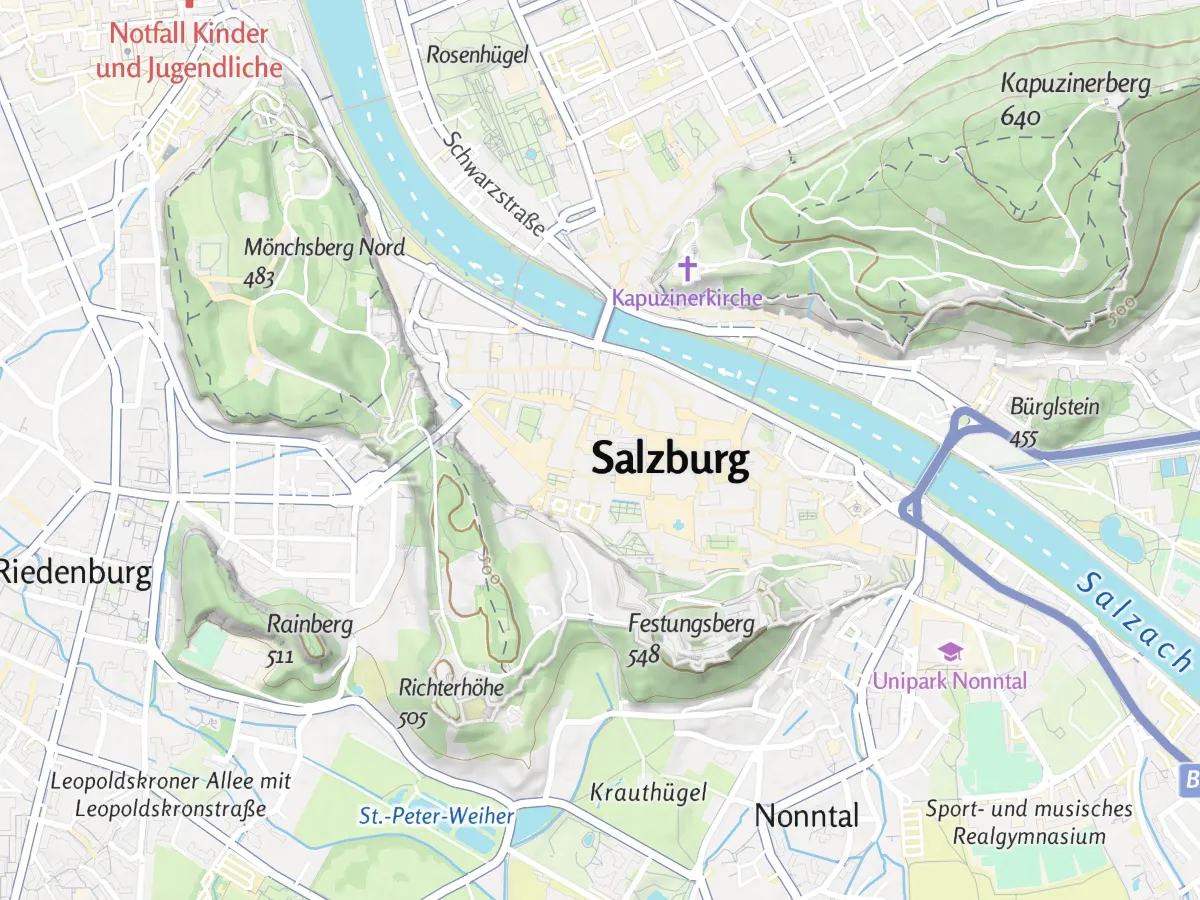
Seven map designs for different uses.
All seven designs are drawn from the same map data, so you can switch between them or offer several to your visitors.
Summer
Outdoor map with mountains shaded in relief. The default design.
Winter
A winter look for snow and ski regions.
Hiking
For hiking, with waymarked trails and their signs.
Cycling
For cycling, with cycle routes and cycle paths.
Street
Detailed city map, with buildings in 3D when you zoom in.
Light
Light and quiet, so your own content stands out.
Dark
Dark design with strong contrast.
Mountains, trails and lakes in detail.
The outdoor designs show what hikers and cyclists need to know: how steep the terrain is, where the trails go and how hard they are.
Contour lines and relief
Contour lines and shading make slopes, valleys and summits easy to read.
Trail difficulty
Hiking paths show their difficulty grade (T1 to T6), mountain-bike and via ferrata grades and the surface.
Water depths
Depth lines show how deep lakes and seas are.
3D terrain
Any design can be shown in 3D with the real height of the mountains, like the map at the top of this page.
Up and running in a few lines.
Add the map to your website or app with one web address, the style URL, in a common map library. The design, the map data and the labels all load from there.
const map = new maplibregl.Map({
  container: "map",
  style: "https://styles.maptoolkit.net/maptoolkit/"
    + "maptoolkit.summer.json?api_key=YOUR_API_KEY",
  center: [11.400, 47.268],
  zoom: 12,
  attributionControl: { compact: false }
});
Replace summer with winter, hiking, cycling, street, light or dark to change the design.
Works with your map library
MapLibre GL JS, Mapbox GL JS, Leaflet and OpenLayers, each with a working example in the docs.
Smooth zooming and turning
The browser draws the map itself, so it zooms and turns without loading new images. Tiles in the MVT format, zoom 0 to 15.
Updated every week
The map data comes from OpenStreetMap and is rebuilt every week.
Hosted in the EU
Maps are served from the European Union, with anonymized IP addresses.
Labels in many languages
Place, street and POI names come in the languages OpenStreetMap has, such as German, English and French.
Elevation included
Contour lines, terrain shading and 3D elevation come with the same API key.
One API key
The key sits in the style URL and is passed on to everything the map loads.
Seven designs or your own
Seven standard styles. Custom styles in your brand colours come with Enterprise.
What you can build with vector maps.
Three common uses, shown with real OpenStreetMap data:
Tour and destination websites
An interactive map of trails, huts and sights, with contour lines and trail grades already in it.
Property portals
Homes on a quiet map, with the schools, shops and metro stops around each one.
Apps that work offline
Maps that keep working in the mountains, without mobile reception.
Questions about vector tiles.
Short answers on map credits, switching from Mapbox or Google, mobile apps and map updates.
Do I have to show a map credit?
Yes. Every map needs a visible credit to Maptoolkit and OpenStreetMap. On the web the credit comes with the map style, so you do not have to write it yourself. In MapLibre, set the attribution control to compact: false; otherwise the credit shrinks to a small icon as soon as someone moves the map.
How do I switch from Mapbox to Maptoolkit?
Replace Mapbox GL JS with MapLibre GL JS, its open-source fork, and swap the script tag, the access token and the style URL. Markers, popups, camera methods and events keep working. Two things take real work: custom layers written for Mapbox Streets, because layer and field names differ, and styles built in Mapbox Studio, since custom map styles come with Enterprise.
Can I move from Google Maps to Maptoolkit?
Yes, in two steps. Routing, geocoding and elevation have direct counterparts, so you can move those first while the map stays where it is. The map itself is a rewrite in MapLibre GL JS or Leaflet. Watch the coordinate order: MapLibre expects longitude first. Places, Street View and live traffic have no equivalent.
Can I use the maps in my iOS or Android app?
Yes. Use the open-source MapLibre native SDK, which runs on iOS, Android and other platforms. It loads the same style URLs as the web, so your app and your website can show the same map. On every map screen, show the credit to Maptoolkit and OpenStreetMap together with the small Maptoolkit logo.
How soon do OpenStreetMap edits show up on the map?
After the next weekly rebuild. The map is rebuilt from OpenStreetMap every Sunday, so a change made in OpenStreetMap appears after the next rebuild, not right away. A browser that has already loaded a tile may keep showing the old one for up to a week. Contour lines and water depths come from separate data and change only rarely.
Find the right map for your project.
In a demo we show the seven designs on your region and talk through what a map in your own colours would involve.