


Weather on your map.
Show temperature, rain and wind as layers on your map, or the forecast for any place in Europe, up to five days ahead. The data comes from the weather models of the German Weather Service and is updated every 3 hours.
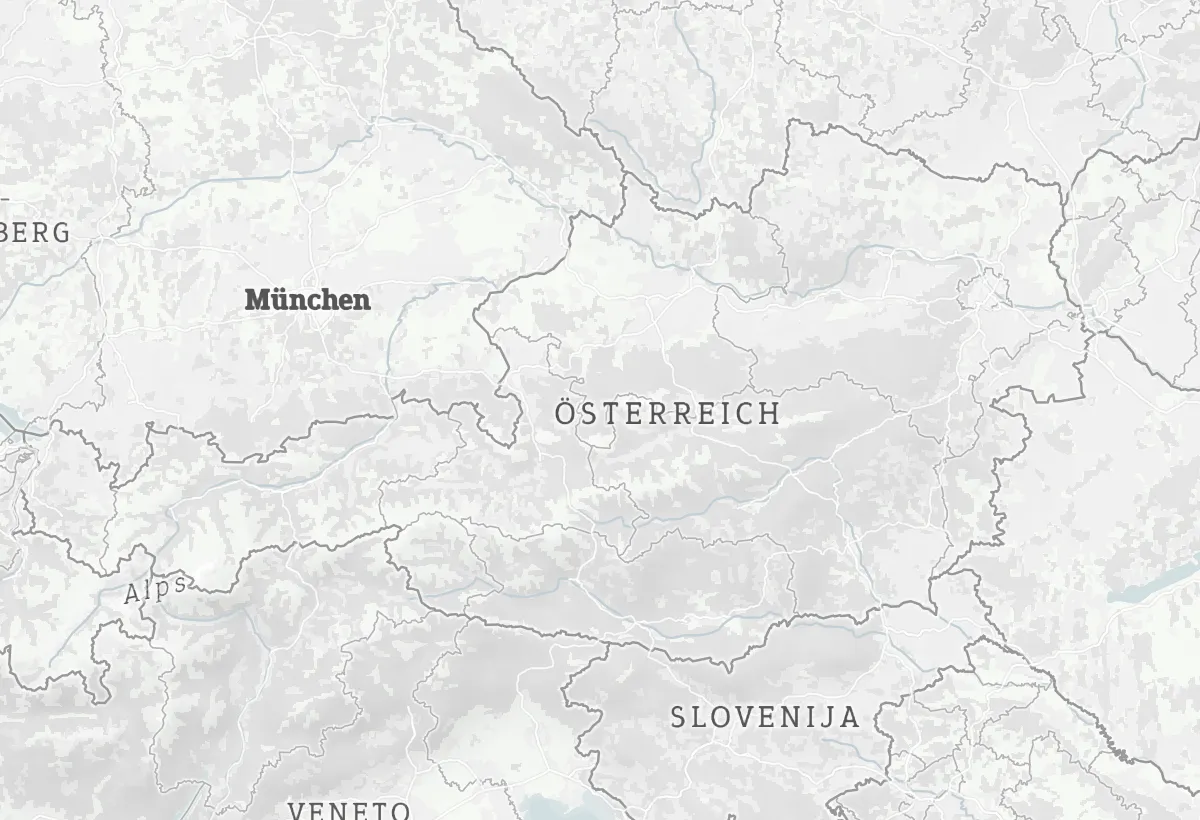
Detailed for Central Europe.
The forecasts come from the ICON weather models of the German Weather Service (DWD): the detailed ICON-D2 for Germany and its neighbors, ICON-EU for the rest of Europe. Up to five days ahead, updated every 3 hours, and shown on any map style.
Model areas from the DWD open data files (ICON-D2: 43.18 to 58.08° N, 3.94° W to 20.34° E; ICON-EU: 29.5 to 70.5° N, 23.5° W to 62.5° E). Country shapes: Natural Earth.
Layers for the map, forecasts for places.
Four kinds of weather data, all from the same forecast:
Temperature
Colored areas from cold to warm, in the colors of the Maptoolkit weather map.
Rain
Where it rains and how much, in millimeters per hour.
Wind
Average wind speed across the map, from calm to storm.
Forecast for one place
Temperature, rain, wind and conditions for any coordinate, for the next hours and days.
Forecast for Saturday, 17 October 2026, 12:00. Weather data: Deutscher Wetterdienst (ICON-D2 and ICON-EU).
A map source and one endpoint.
Add the weather as a vector source to your MapLibre map, or as raster tiles to Leaflet. For one place, ask the forecast endpoint and get JSON back. The Weather API is part of Maptoolkit Enterprise.
const url = "https://weather.maptoolkit.net/forecast/icon/" +
  "?lat=47.27&lng=11.40&forecast=24&api_key=YOUR_API_KEY";
const hours = await (await fetch(url)).json();
// [..., { temperature: 12, precipitation: 0,
//   wind_speed: 0, wind_gusts: 1, wind_direction: 22.5,
//   weather_code: 0, date: "2026-10-17 10:00:00 UTC" }, ...]
At noon on Saturday this answer says: 12 °C, no rain, clear sky (code 0).
Vector tiles
Polygon layers temperature, precipitation, wind and weather; the values are in °C, mm/h and m/s, plus a weather code.
Raster tiles
The same forecast as image tiles for Leaflet (raster/icon.{hours}.json).
Time steps
icon.0 is the latest model step, then icon.3, icon.6 and so on up to icon.120 (hours ahead).
Forecast for a coordinate
lat and lng, plus forecast for the number of hours. Without it you get the current hour.
Weather codes
Conditions as WMO codes, from 0 for clear sky to 96 for a thunderstorm with hail.
Coverage
Europe. Outside the model area the forecast endpoint answers 404.
Where the weather helps.
Wherever people plan something outdoors. Three common examples:
Tour and destination websites
The forecast next to every tour, so visitors pick the right day.
Weather in your app
Rain, temperature and wind as layers on the map your users already know.
Planning tools
Wind and rain for the next days inside your own software, for work that depends on the weather.
Forecasts in these examples are real Weather API data for Saturday, 17 October 2026. Weather data: Deutscher Wetterdienst (ICON-D2 and ICON-EU).
Questions about weather.
Short answers on coverage, the DWD credit, zoom levels, forecast steps and labels.
Does the Weather API include historical weather or weather warnings?
No. The Weather API covers the current weather and forecasts up to five days ahead. It does not provide past weather data, weather alerts or warnings, or radar images. For any of these you need another source. There is also no data outside Europe, because the forecast models only cover the European area.
Do I have to credit the German Weather Service?
Yes. The weather data comes from the Deutscher Wetterdienst (DWD) under the CC BY 4.0 license, so the DWD needs a visible credit wherever you show it. The weather source already carries that credit, and the map adds it to its attribution next to Maptoolkit and OpenStreetMap. In MapLibre, set the attribution control to compact: false so the credit stays visible.
How far can I zoom in on the weather layers?
The weather tiles cover zoom levels 3 to 8. If you zoom in further, the map keeps showing the zoom 8 data, enlarged. Below zoom 3 the weather layer disappears, so set your map’s minimum zoom to 3. In Leaflet with the maplibre-gl-leaflet plugin, the same limit is zoom 4, because the plugin counts zoom levels differently.
Is the full five-day forecast always available?
Almost. The forecast reaches up to 120 hours ahead, in 3-hour steps, so only multiples of 3 are valid. The horizon moves with each new model run, so the last one or two steps close to 120 hours may not be available yet, and requests for them can return an error. Build your app to fall back to the latest step that is available.
Can I show temperatures as numbers on the map, not only as colors?
Yes. Besides the colored areas, the weather tiles carry point layers with the actual values. One is a grid of points with the full forecast values, the other holds place names with their current weather. In MapLibre, a symbol layer can print the temperature or wind speed next to each place on top of the map.
See your use case on a Maptoolkit map.
In the demo, one of our engineers walks you through the platform, your data and the move from your current provider.